Menu
- 130 King Street West, Suite 1800
- P.O. Box 427
- Toronto, ON, Canada M5X 1E3
- (416) 865-3392
- info@triparagon.com
In today’s ever-changing data center environment, insights from data provide a critical competitive advantage. But with the massive volume and variety of data generated by your data center devices, who has the time or training to collect that data, analyze it, gain insights from it, and ultimately derive value from it?
It’s simply not possible with traditional data analysis or old-school tools like Visio and Excel. But data center professionals need to figure out how to harness the power of their data, or risk being left behind.

Zero-Configuration Analytics
Business intelligence and analytics are fast, easy, and accessible with Sunbird’s DCIM dashboards and reports. Based on feedback from customers, we’ve developed dashboards that come preconfigured out of the box with the KPIs and metrics most useful for easing your data center pain points. Configure the size and order of your charts for faster, more focused data analysis, or display the specific information you want with customizable reports.
Make More Informed Decisions
You don’t need to worry about “garbage in, garbage out” with Sunbird. Gathering data directly from the devices in your data center ensures accurate, high-quality information that leads to deeper, more reliable insights. Make it simple for your people to make smarter, more informed data center management decisions. Try Sunbird’s KPI-driven data center BI and analytics today.
Democratize Your Data Center KPI’s
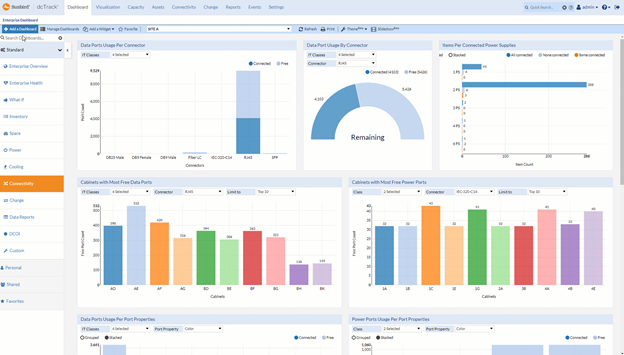
Your ultimate data center dashboard has arrived.
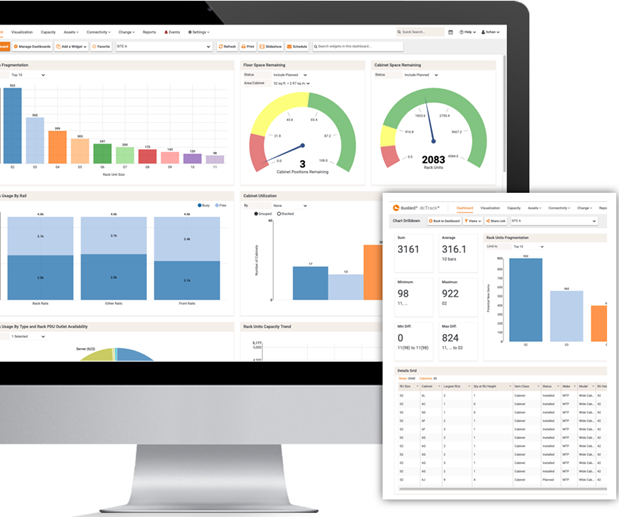
Visual data center analysis: Slice and dice your data any way you want it.
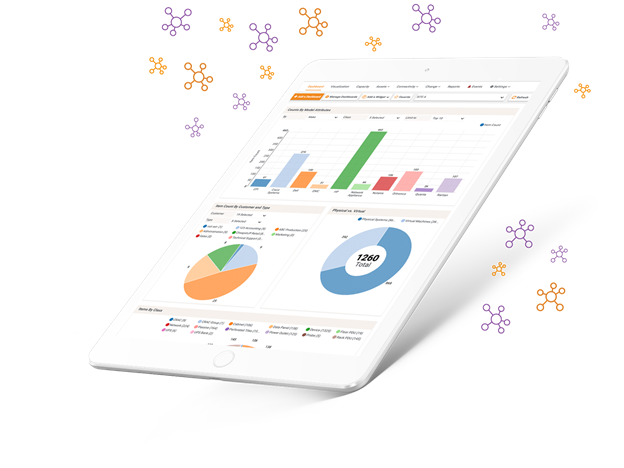
Over 100 Interactive Reports at Your Fingertips. Sunbird’s prebuilt, interactive reports provide the data center business intelligence with the biggest impact for data center teams.
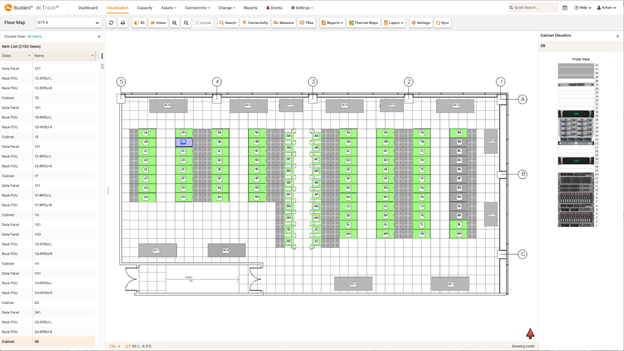
Add an additional layer of insight with floor map overlay reports.
Floor map reports overlay on your data center visualizations for enhanced data analysis.

Out-of-the-box and custom reports for every data center scenario.
Power consumption reports provide a quick and easy way to identify which cabinets have available capacity, delaying expensive capital expenditure and improving resource efficiency.
Capacity forecast charts with trend lines and days-of-supply projections enable you to accurately estimate future needs and address potential shortages before you exceed capacity.
Bill back reports enable you to charge individual organizations or internal customers based on usage, ensure equitable distribution of power and energy charges, and drive energy efficiency and sustainability initiatives.
Rack capacity and failover reports simulate if your racks can handle a failover situation, without impacting equipment in use, and enable you to eliminate outage concerns by identifying available capacity for coverage in case of failure.
Real-time, interactive data center health maps increase uptime by providing advanced warnings of issues, such as hot spot formation, power capacity limitations, and loss of redundancy, and helps you understand the impact of equipment failure and maintenance
Custom tags and tag groups allow you to categorize the facility items in your data centers using the nomenclature specific to your organization, ensuring that everyone understands the information and items covered in your reports.
Plan for today and in the future. Zoltar can’t help you predict if you’ll run out of capacity, but we can.

Why Sunbird?
We’re a leader in what is known as Second-Generation DCIM Software, and we focus on solving real customer problems…instead of charging for every module or user.
In Canada contact Tri-Paragon at 416 865-3392 or email us at info@triparagon.com for more information and to request a demo of the Sunbird DCIM Software and see how it provides the information and control of your data center you’ve been looking for.